Hypothesis Tests and Confidence Intervals

The position of the graphically represented keys can be found by moving your mouse on top of the graphic. The top row of function keys is considered to be row 1.

On this page, I will describe how to do the following functions:
A one-sample t-test
A one-sample z-test
A z-confidence interval
A t-confidence interval

T-tests and Z-tests
Note: a z-test and z-interval are used when the population standard deviation is known. If it not known, the t-test and t-interval are used. The sample standard deviation is computed in lieu of the population standard deviation. Technically, you should only use z-tests with data sets of more than 30 numbers. The examples shown here are thankfully smaller.
T-tests: one variable
The Problem: Given a list of numbers, is the mean of that list significantly different than m0?
The Solution:  Press The Orange Arrow Key: Row 9, Column 1 The Five Key: Row 8, Column 3. A menu will appear. Choose The Five Key: Row 8, Column 3 for Hypoth. tests. Press The F6 Key: Row 1, Column 6 (OK) or The Enter Key: Row 10, Column 5. A new menu appears. Choose The Five Key: Row 8, Column 3 for T-Test 1 m. Press The F6 Key: Row 1, Column 6 (OK) or The Enter Key: Row 10, Column 5. The first cursor is labeled m0. Enter its value and press The F6 Key: Row 1, Column 6. Next is n, the number of data values. Enter it and press The F6 Key: Row 1, Column 6. Enter x and press The F6 Key: Row 1, Column 6. Enter sx and press The F6 Key: Row 1, Column 6. Enter your alpha value (usually 0.05) and press The F6 Key: Row 1, Column 6. A window called Alternative Hypothesis will show. Press The Down Arrow: Row 2, between Columns 4 and 5 The Down Arrow: Row 2, between Columns 4 and 5 to get to m ≠ 4 (or whatever number you entered for m0). Press The F6 Key: Row 1, Column 6. The results will appear in a new screen.
Example: For the following list of numbers: 7 6 5 7 4 3 4 4 6 5:
  1. Run a t-test to check to test if the mean is different than 4.
  2. Run a t-test to test if the mean is larger than 5.

Solution: 

  1. Find the mean and the standard deviation. Mean is 5.1. Standard Deviation is 1.37. Now press The Orange Arrow Key: Row 9, Column 1 The Five Key: Row 8, Column 3 (STAT) The Five Key: Row 8, Column 3 (Hypoth. tests) The F6 Key: Row 1, Column 6 (OK) The Five Key: Row 8, Column 3 (T-Test 1 m) The F6 Key: Row 1, Column 6 (OK) The Four Key: Row 8, Column 2 (m0) The F6 Key: Row 1, Column 6 The One Key: Row 9, Column 2 The Zero Key: Row 10, Column 2 (n) The F6 Key: Row 1, Column 6 The Five Key: Row 8, Column 3 The One Key: Row 9, Column 2 (x) The One Key: Row 9, Column 2 The Three Key: Row 9, Column 4 The Seven Key: Row 7, Column 2 (sx) The F6 Key: Row 1, Column 6 The F6 Key: Row 1, Column 6 The Down Arrow: Row 2, between Columns 4 and 5 The Down Arrow: Row 2, between Columns 4 and 5 The F6 Key: Row 1, Column 6
  2. Find the mean and the standard deviation. Mean is 5.1. Standard Deviation is 1.37. Now press The Orange Arrow Key: Row 9, Column 1 The Five Key: Row 8, Column 3 (STAT) The Five Key: Row 8, Column 3 (Hypoth. tests) The F6 Key: Row 1, Column 6 (OK) The Five Key: Row 8, Column 3 (T-Test 1 m) The F6 Key: Row 1, Column 6 (OK) The Five Key: Row 8, Column 3 (m0) The F6 Key: Row 1, Column 6 The One Key: Row 9, Column 2 The Zero Key: Row 10, Column 2 (n) The F6 Key: Row 1, Column 6 The Five Key: Row 8, Column 3 The One Key: Row 9, Column 2 (x) The One Key: Row 9, Column 2 The Three Key: Row 9, Column 4 The Seven Key: Row 7, Column 2 (sx) The F6 Key: Row 1, Column 6 The F6 Key: Row 1, Column 6 The Down Arrow: Row 2, between Columns 4 and 5 The F6 Key: Row 1, Column 6

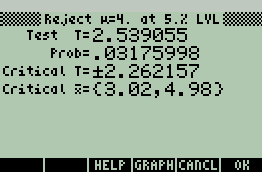
You should see the following for the first question:

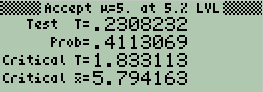
Since p<0.05, we reject the null hypothesis and affirm that the mean is not 4.

For the second question, we get

Since p>0.05, we cannot reject the null. The mean could be 5.

Z-tests: one variable
The Problem: Given a list of numbers, is the mean of that list significantly different than µ0?
The Solution: Press The Orange Arrow Key: Row 9, Column 1 The Five Key: Row 8, Column 3 (STAT) You will see a menu. Choose The Five Key: Row 8, Column 3 for Hypoth. tests. Press The F6 Key: Row 1, Column 6 (OK) or The Enter Key: Row 10, Column 5. A new menu appears. Press The F6 Key: Row 1, Column 6 to accept Z-test 1 m. A new screen appears. The first cursor is labeled m0. Enter its value and press The F6 Key: Row 1, Column 6. Next is s, the standard deviation. Enter it and press The F6 Key: Row 1, Column 6. Enter x and press The F6 Key: Row 1, Column 6. Enter sx and press The F6 Key: Row 1, Column 6. Enter your alpha value (usually 0.05) and press The F6 Key: Row 1, Column 6. A window called Alternative Hypothesis will show. Press The Down Arrow: Row 2, between Columns 4 and 5 The Down Arrow: Row 2, between Columns 4 and 5 to get to m ≠ 4 (or whatever number you entered for m0). Press The F6 Key: Row 1, Column 6. The results will appear in a new screen.
Examples: The following list of numbers: 1  9  6  5  3  8 come from a distribution with s = 2.75.
  1. Run a z-test to test if the mean is 5.3.
  2. Run a z-test to test if the mean is larger than 5.

Solutions: 

  1. Find the mean. Mean is 5.33. Now press The Orange Arrow Key: Row 9, Column 1 The Five Key: Row 8, Column 3 (STAT) The Five Key: Row 8, Column 3 (Hypoth. tests) The F6 Key: Row 1, Column 6 (OK) The F6 Key: Row 1, Column 6 (Z-Test 1 mThe Five Key: Row 8, Column 3 The Three Key: Row 9, Column 4 (m0) The F6 Key: Row 1, Column 6 The Two Key: Row 9, Column 3 The Seven Key: Row 7, Column 2 The Five Key: Row 8, Column 3 (s) The F6 Key: Row 1, Column 6  The Five Key: Row 8, Column 3 The Three Key: Row 9, Column 4 The Three Key: Row 9, Column 4  (x) The F6 Key: Row 1, Column 6 The One Key: Row 9, Column 2 The Zero Key: Row 10, Column 2 (n) The F6 Key: Row 1, Column 6 The F6 Key: Row 1, Column 6 The Down Arrow: Row 2, between Columns 4 and 5 The Down Arrow: Row 2, between Columns 4 and 5 The F6 Key: Row 1, Column 6
  2. Find the mean. Mean is 5.33. Now press The Orange Arrow Key: Row 9, Column 1 The Five Key: Row 8, Column 3 (STAT) The Five Key: Row 8, Column 3 (Hypoth. tests) The F6 Key: Row 1, Column 6 (OK) The F6 Key: Row 1, Column 6 (Z-Test 1 mThe Five Key: Row 8, Column 3  (m0) The F6 Key: Row 1, Column 6 The Two Key: Row 9, Column 3 The Seven Key: Row 7, Column 2 The Five Key: Row 8, Column 3 (s) The F6 Key: Row 1, Column 6  The Five Key: Row 8, Column 3 The Three Key: Row 9, Column 4 The Three Key: Row 9, Column 4  (x) The F6 Key: Row 1, Column 6 The One Key: Row 9, Column 2 The Zero Key: Row 10, Column 2 (n) The F6 Key: Row 1, Column 6 The F6 Key: Row 1, Column 6 The Down Arrow: Row 2, between Columns 4 and 5 The F6 Key: Row 1, Column 6

For question 1, you should get z=.03449757 and p=.9724804.
For question 2, you should get z=.3794733 and p=.3521682.
In both cases, we cannot reject the null.


Confidence intervals
Using the t-distribution
The Problem: Find an interval for which you can be p% confident that it contains the population mean.
The Solution: Press The Orange Arrow Key: Row 9, Column 1 The Five Key: Row 8, Column 3 (STAT) You will see a menu. Choose The Six Key: Row 8, Column 4 for Conf. interval. Press The F6 Key: Row 1, Column 6 (OK) or The Enter Key: Row 10, Column 5. A new menu appears. Press The Five Key: Row 8, Column 3 to accept T-test 1 m. Press The Enter Key: Row 10, Column 5. A new screen appears. The first cursor is labeled x. Enter its value and press The F6 Key: Row 1, Column 6. Next is sx, the standard deviation. Enter it and press The F6 Key: Row 1, Column 6. Enter n and press The F6 Key: Row 1, Column 6.  Enter c, the level of confidence (usually 0.95) and press The F6 Key: Row 1, Column 6 The F6 Key: Row 1, Column 6. The results will appear in a new screen.
Example: For the following list of numbers: 8 4 3 8 1 2 2 0 0 6, construct a 95% confidence interval.

Solution: Compute the mean and standard deviation. The mean is 3.4. The standard deviation is 3.03. Now press The Orange Arrow Key: Row 9, Column 1 The Five Key: Row 8, Column 3 (STAT) The Six Key: Row 8, Column 4 (Conf. interval) The F6 Key: Row 1, Column 6 (OK) The Five Key: Row 8, Column 3 (T-test 1 m) The Enter Key: Row 10, Column 5 The Three Key: Row 9, Column 4 The Four Key: Row 8, Column 2 ( x) The F6 Key: Row 1, Column 6 The Three Key: Row 9, Column 4 The Zero Key: Row 10, Column 2 The Three Key: Row 9, Column 4 (sx) The F6 Key: Row 1, Column 6 The One Key: Row 9, Column 2 The Zero Key: Row 10, Column 2 (n) The F6 Key: Row 1, Column 6 The Zero Key: Row 10, Column 2 The Nine Key: Row 7, Column 4 The Five Key: Row 8, Column 3 (c) The F6 Key: Row 1, Column 6 The F6 Key: Row 1, Column 6

You should see the following:

Critical T=±2.262157
m min = 1.232469
m max = 5.567531.

Hence the confidence interval is (1.232, 5.568)

Using the z-distribution
The Problem: Find an interval for which you can be p% confident that it contains the population mean. The standard deviation is known to be s.
The Solution: Press The Orange Arrow Key: Row 9, Column 1 The Five Key: Row 8, Column 3 (STAT) You will see a menu. Choose The Six Key: Row 8, Column 4 for Conf. interval. Press The F6 Key: Row 1, Column 6 (OK) or The Enter Key: Row 10, Column 5. A new menu appears. Press The F6 Key: Row 1, Column 6 to accept Z-test 1 m. Press The Enter Key: Row 10, Column 5. A new screen appears. The first cursor is labeled x. Enter its value and press The F6 Key: Row 1, Column 6. Next is s, the standard deviation. Enter it and press The F6 Key: Row 1, Column 6. Enter n and press The F6 Key: Row 1, Column 6.  Enter c, the level of confidence (usually 0.95) and press The F6 Key: Row 1, Column 6 The F6 Key: Row 1, Column 6. The results will appear in a new screen.
Example: For the following list of numbers: 8 4 3 8 1 2 2 0 0 6, construct a 95% confidence interval. Take s to be 3.

Solution: Compute the mean. The mean is 3.4. Now press The Orange Arrow Key: Row 9, Column 1 The Five Key: Row 8, Column 3 (STAT) The Six Key: Row 8, Column 4 (Conf. interval) The F6 Key: Row 1, Column 6 (OK) The F6 Key: Row 1, Column 6 (Z-test 1 m) The Enter Key: Row 10, Column 5 The Three Key: Row 9, Column 4 The Four Key: Row 8, Column 2 ( x) The F6 Key: Row 1, Column 6 The Three Key: Row 9, Column 4 (s) The F6 Key: Row 1, Column 6 The One Key: Row 9, Column 2 The Zero Key: Row 10, Column 2 (n) The F6 Key: Row 1, Column 6 The Zero Key: Row 10, Column 2 The Nine Key: Row 7, Column 4 The Five Key: Row 8, Column 3 (c) The F6 Key: Row 1, Column 6 The F6 Key: Row 1, Column 6

You should see the following:

Critical Z=±1.959964
m min = 1.540615
m max = 5.259385


Other Hp50g Pages:

HP's online manual sample problem set home page
Normal Probabilities Basic Stats  

* Technically, this is the manual for the 49g+, but the commands are the same for both calculators.

1