Problems with normal probabilities
The position of the graphically
represented keys can be found by moving your mouse on top of the graphic.
The row of function keys: f1, f2, etc. do not count as a row. Row 1 starts
with the blue 2nd key.
| Drawing a normal curve | ||
| The problem is finding P(a < X < b) where X is a random variance with a specified mean and standard deviation. Also, drawing the graph. | ||
| Get to the
Stats/List Editor. That is: Press
|
||
| Note: If you want to graph P(X < b), choose a to be very
small, that is, more than three standard deviations below the mean.
Example if m is 4 and
s is 2, then a should be -4 or less.
If you want to graph P(X > a), choose b to be very big, that is, more than three standard deviations above the mean. Example if m is 4 and s is 2, then b should be 10 or more. |
||
| Computing probabilities without the graph | ||
| The problem is finding P(a < X <b) where X is a random variance with a specified mean and standard deviation. | ||
Press
|
||
Worked Out Examples
In the following examples, we list the exact
key sequence used to find the answer. We will list the keys by the main symbol
on the key. In parentheses, we will list a helpful mnemonic, e.g. we will list
ex as 
 (ex).
(ex).
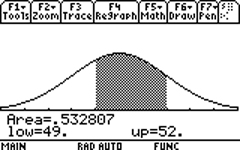
| Question 1: Let X be a random variable with
m=50
and s=2. Draw a normal curve to compute and illustrate P(49< X <52). |
||||
| Solution:
|
||||
|
Graph should look like this:
Note: Graph window has x-min=45, x-max=55, y-min=-0.1 and y-max=0.3. |
||||
| Question 2: Let X be a random variable with m=10 and s=3. Compute, but don't draw the graph for P(X >7). | ||||
| Solution:
|
||||
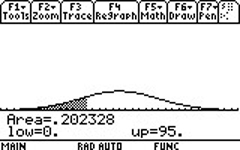
| Question 3: Let X be a random variable with
m=100
and s=6. Draw a normal curve to compute and illustrate P(X < 90). |
||||
| Solution:
|
||||
| Graph should look like:
Note: Graph window has x-min=82, x-max=118, y-min=-0.1 and y-max=0.3. |
||||
Go to: